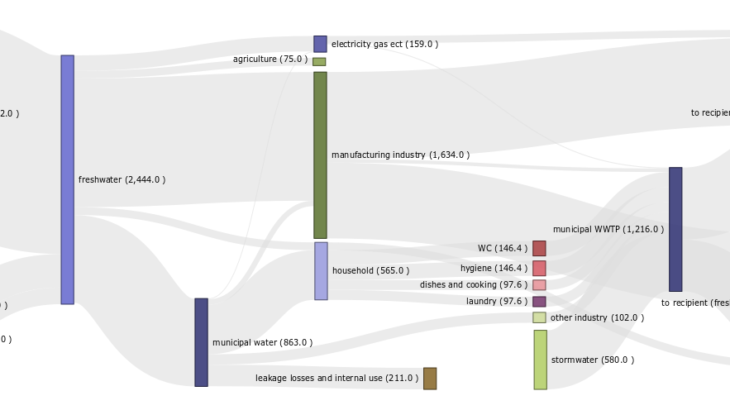
I found this sankey graph really enlighting in terms of how water is routed in the technosphere, and there are several insights revealed here, perhaps most interestingly the losses and internal use in drinking water treatment and distribution amount to 25%, and the volume of stormwater treated by wastewater treatment plants even exceed the volume of actual household wastewater (580 Mcbm compared to about 480 Mcbm). We can also see that groundwater contribute about 13% to the freshwater supply, although we can assume that a larger proportion of this is used for municipal drinking water.
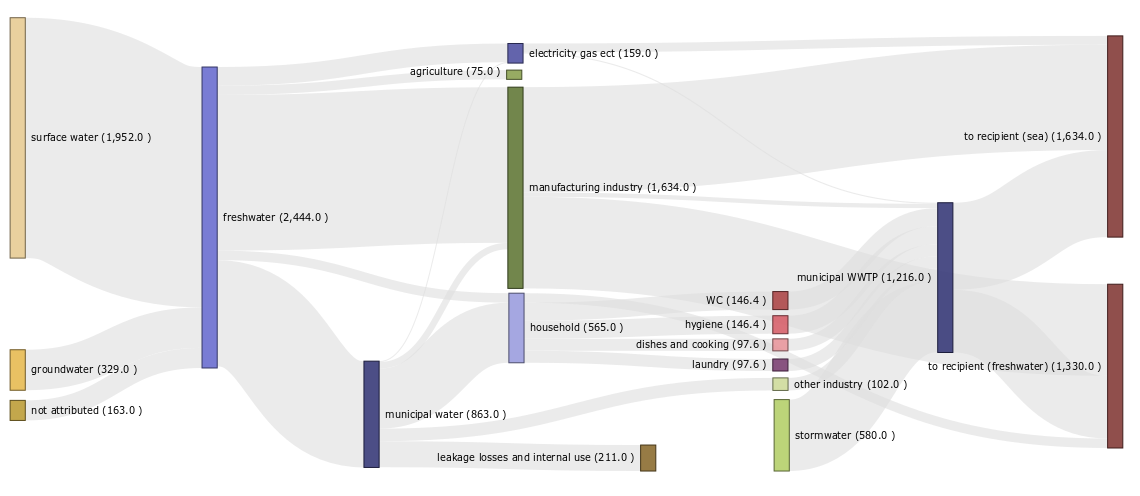
Figure 1. Water flows in the Swedish technoshpere 2015. Values are in million cubic meters.